
Well it’s been two long weeks spent back testing and trying various permutation based upon the hypothesis discusses in my last article. I am going to jump right in and go into some of the things I found and discuss the various back testing results. As usual None of this if financial advice!
The bot’s name was chosen because I read a post about WandaVision before I started writing the code for this.
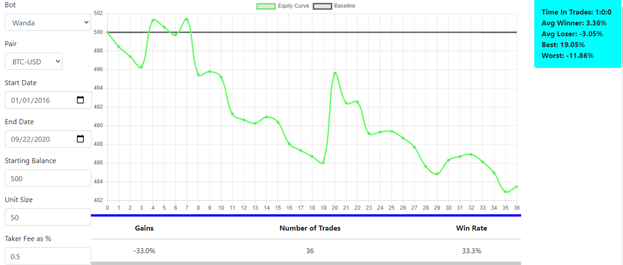
Now I was not surprised when the results came back but I was secretly hoping it would just be profitable. The strategy sold after a streak of one red day followed by five green days and bought back in after holding for only 24 hours. This was based on the research discussed in the last article but was not even close to tradeable. However, it was useful as it identified every five-day run BTC had over the designated time period. I was then able to go into Tradingview and look at each trade and see what the conditions were like. I put these notes into an excel sheet for further interaction. One thing to mention is the win rate doesn’t necessarily mean that a red day only followed five consecutive green days one third of the time, as a winner requires the red day to overcome the loss incurred by paying exchange fees, which are currently set to 0.5% both ways (Coinbase Market Orders).
Some of the things I jotted down as I scrolled through historical data was as follows:
- most of the trades had a significant (>1%) wick down that was missed by holding till the close
- most losses were due to the volatility not being high enough for a day within the average true range to even be profitable
- some of the massive losses could be handled with a simple stop loss price
- The average winner was greater than the average movement down for any given day during that time (~-4% vs -2.5% all before fees) so this made me think there might be something to this
So, armed with this information I went onto the next step, a volatility filter
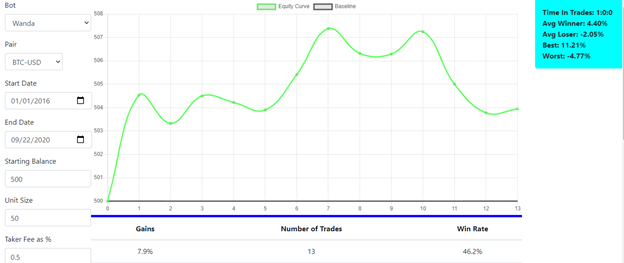
This minor adjustment yielded some quite different results. Now I would not qualify this as tradeable just yet but there was a great amount of improvement. For starts it ended up profitable during the given period (still Jan 1st, 2016 until Sep 22nd ,2020). The win rate also increases by over 25% and the average loser decreased while the average winner increased. It looks like the hunch was correct but this itself is still not tradable. The equity curve gives back far too much and over the course of years is in a draw down since January 2019. Another concerning thing is the trade frequency. We filtered out 23 trades, meaning because of the ATR filter we did skipped 23 opportunities that were taken during the first run. This dramatically reduces the average trade frequency from once every five weeks or so to less than once a quarter. Now I am not opposed to such a strategy. Since I use automation patiently waiting is kind of my jam. However, for me to trade it the equity curve is going to need to look way better than this.
Since there were only 13 trades going back and looking at each of them and taking some note should not take too long.
...
I noticed that for these trades there were a substantial amount where the downtrend continued for a second day in a row. By just holding for this second day both the win rate and the gains increased, the gains almost doubling.
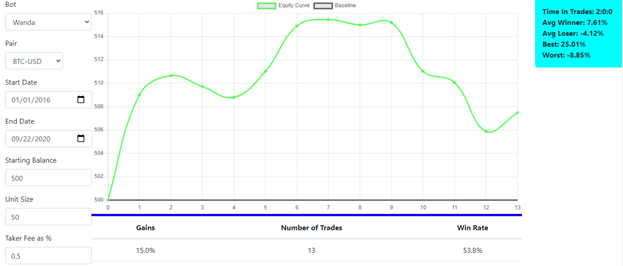
However, this is still not a tradable curve, or at least I would not trade it. Now I could start working on stop loss logic to stem the bleeding of the larger losses but the issue in fact goes deeper than that. This brings me to my next point…
Overfitting
If you get nothing else from this understand two things.
- One strategy should for the most part work for more than one asset.
- No one strategy will work for all assets
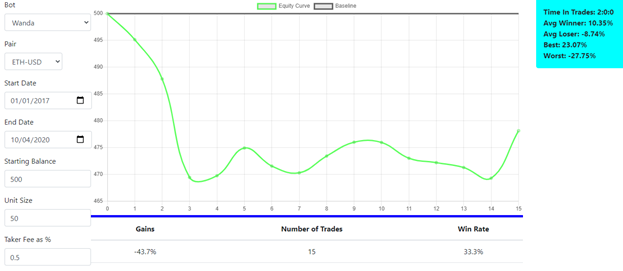
Armed with this know that whenever I develop a trading plan or strategy, I compare results of similar assets. Bitcoin, Ethereum and until recently Litecoin all tracked closely together. I have noticed that recently LTC has started to slip out of favor. I want to see a similar equity curve between BTC-USD and ETH-USD, and I did not.
Conclusion
Though the idea seem pretty solid from the start and we were able to isolate a profitable pattern, the research was able to identify some flaws and conclude that baring anymore through investigation the strategy should be left in the archives.
Please please please remember that none of this is financial advice! And thank you again for stopping by! I really enjoyed this format and am going to start another research project soon.